This article sheds light on the current indicators of China’s economy, and compares them to indicators that led to Japan’s Lost Decade.
Japan’s Lost Decade
Figure 1: Japanese Yen / U.S Dollar Foreign Exchange Rates

In the wake of the Plaza Accord, and as the Japanese Yen appreciated against the US Dollar, not only did US exports become cheaper but Japanese exports became more expensive. This meant that US net exports increased while Japanese net exports declined. As a result, Japanese net exports as a function of nominal GDP saw a severe drop in 1985 following the Plaza Accord (Figure 2).
Figure 2: Japan Net Exports / GDP, 1985-1995

The steep decline in Japanese net exports and strong appreciation of the Japanese Yen heavily eroded the export dependent Japanese economy. In order to prevent any further damage to the local economy, the Bank of Japan pursued a series of aggressive monetary easing over the course of 1986 to 1987. Initially, the discount rate was cut from 5.0% to 4.5% in January of 1986, followed by a series of cuts over the next year to 2.5% in February of 1987.
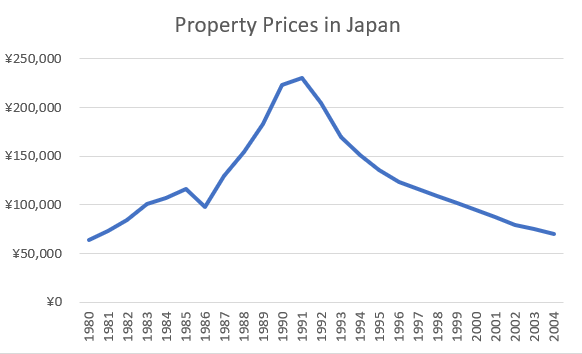
Lower interest rates attracted investors to invest in the assets market. As stock prices increased, companies tended not to borrow money from banks and instead issued more stock to raise capital. Because of this change in behavior, banks became desperate to find customers to lend money to and started to search for owners of vacant lands, suggesting houses and apartments be built. This is how the price of property and stock shot up in the aftermath, creating a bubble. The Nikkei index hit a historical high of 38,957 JPY in December 1989 (Figure 3). Similarly, property prices reached historical highs in 1990 (Figure 4).
Figure 3: Price of the Nikkei Index
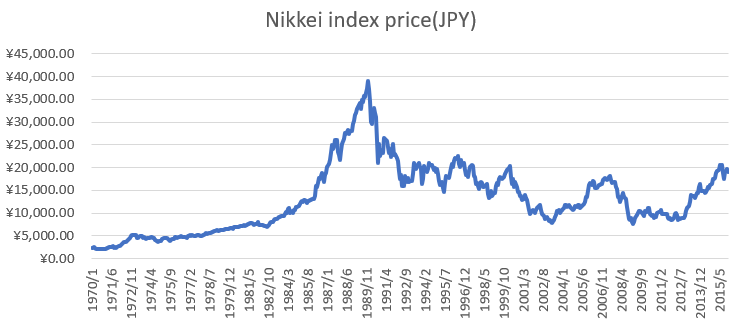
Figure 4: Property Prices in Japan
Simultaneously, the Japanese government also introduced “total volume control policy”, which required banks to lower the ratio of money lent for the purpose of property investment. Consequently, the borrowing rate from the banks increased and banks started to limit its lending for property investment, which led to a decrease in the demand for property.
Once this downward spiral of stock and property prices began in the market, the decrease of one side accelerated the decrease in the other side, and this rapid economic downturn became inevitable in Japan. Consequently, the Nikkei Index plunged to below 20,000 JPY in 1990, almost half its value from the year before. Property prices reversed sharply as well.
The economic bubble had burst, and the Japanese economy suffered severe slowdown in 1990s. The growth rate went down to nearly 0% and deflation also took place. This trend continued until 2003, when the economy started to recover at last, and the period of economic slowdown in 1990s is now referred to as the “lost decade”.
China’s Current Economic Climate: A Repeat of Japan’s Mistakes?
- Increasing Money Supply, Appreciation of the Yuan, and Decreasing Exports
2008 was the turning point of the global economy. The financial crisis caused the US and global economic growth slow down. As the demand from US and EU, the two biggest exporters for China, got weaker, the export growth rate dived from 51.6% in Feb to 21.7% in Dec, 2007. On the other hand, in order to stimulate the economy, the Fed has since introduced 3 rounds of Quantitative easing(QE), pushing the RMB/USD exchange rate go below 7. As the RMB appreciates against USD, there is a greater downward pressure on China’s export and overall GDP at that moment.
To respond to the situation, the central government realized that China’s economy needed to transform from being export driven to one that was domestic-consumption driven. Therefore, in 2008, State Council approved a plan to invest 4 trillion yuan in infrastructure and social welfare by the end of 2010. This stimulus was invested in key areas such as housing, rural infrastructure, transportation, health and education, environment, industry, disaster rebuilding, income-building, tax cuts, and finance. The effect of the 4 trillion stimulus was hugely successful, China’s GDP growth rate remained at more than 10% from 2008-2010.
Along with the 4 trillion yuan stimulus, People’s Bank of China (PBoc) has been ramping up money supply from 2003-2016 – just as the Bank of Japan did from 1985-1995. The year-on-year growth consistently hovered around 15% on average, as compared to 4-5% in Japan from 1985-1995 (Figure 5). This money supply increase was particularly acute in and around 2008 after the financial crisis, when China’s Exports to GDP ratio aggressively dropped (Figure 6), with RMB appreciating against the USD (Figure 7).
Figure 5: The sharp increase in China’s money supply in recent years, similar to Japan’s ‘lost decade’
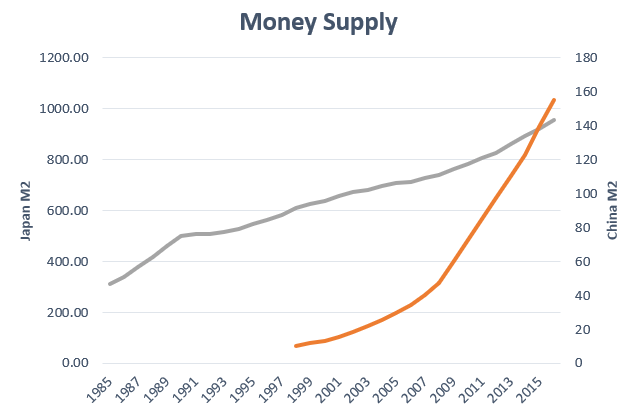
Figure 6: China’s Net Exports / GDP. Note the sharp decrease after the 2008 financial crisis

Figure 7: Yuan/USD exchange rates

2. Surge In Property Prices, and unattractive Rental Yields
Since 2004, property prices in China have been rising sharply. The increase, as discussed earlier, has been triggered by low interest rates triggering heavy borrowing and other periphery factors have contribute to more investments in properties: urbanization in tier-1 cities, rising disposable income levels, and cultural values that favour property holdings. In tier 1 cities, especially in Shenzhen, property prices surged by 400% between 2004 and 2015 as opposed to tier 2 and tier 3 which increased by 300% to 350% over the same period (Figure 8).
Figure 8: Property prices in tier 1 cities are rising faster than the national average

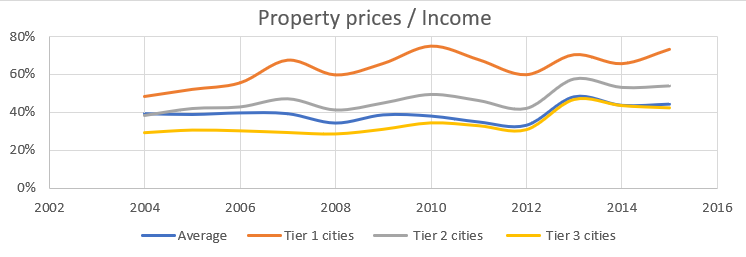
The National Bureau of Statistics of China publishes an affordability ratio linking monthly house expenses to disposable income for Chinese cities, and this ratio has deteriorated a lot over the years, especially in tier 1 cities. This shows that property prices have increased at a greater rate than income growth (Figure 9), very similar to what happened in Japan.
Figure 9: Property prices have risen faster than income levels
3.China’s Aging Demographic
Japan has long epitomized the shift to an older and smaller population; its population began falling in 2004 and has not recovered. Economists have recently identified a similar problem in China, where the working-age population has begun to shrink.
Life expectancy will keep increasing and fertility will keep decreasing on a global scale, indicating an increasing population of older people. For China, the situation looks dangerously like Japan’s. Its historical data and projections follow Japan’s almost exactly, but with a 25 year lag time (Figure 10).
This decreasing working population will deteriorate the future of China’s GDP.
Figure 10: China and Japan’s working population

Takeaways
The economic indicators signal that China might be treading along the same path as Japan in the 90s. What do you think?
